Shimadzu Detector-Related Issues
13 - Detector Issues
14 - Flow Line Leakage
15 - Course Summary
In the last two course units, we explored factors affecting column lifespan. Beyond the column, every (U)HPLC system relies on a detector to visualise chromatographically separated substances. This section highlights common detector-related problems and their possible causes.
Baseline Noise

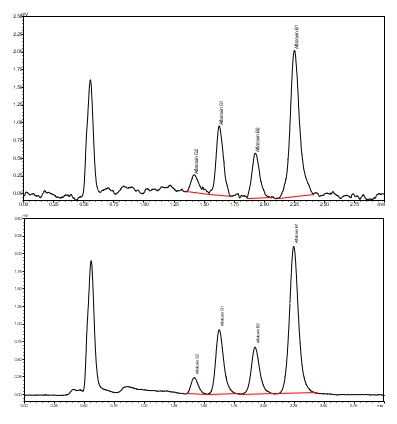
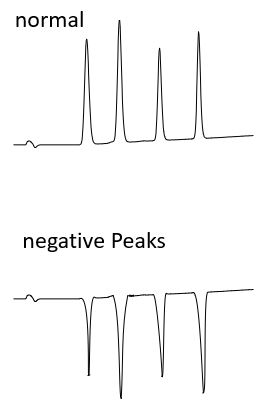
The two figures on the right show aflatoxins analysis using a UV detector. In the upper figure, a significant increase in baseline noise is evident compared to the lower figure. If peak areas remain constant and the pressure profile appears normal, potential causes include:
- A weak D2 lamp
- A contaminated flow cell
- Dirty optics
- A turned-off degasser
Drifting Baseline (RID - Refractive Index Detector)
For refractive index and conductivity detectors, cell temperature has a particularly large impact on the baseline. If the temperature is unstable, the RID may exhibit drifting baseline. The below figure demonstrates how small temperature fluctuations in the RID flow cell can significantly impact the baseline.
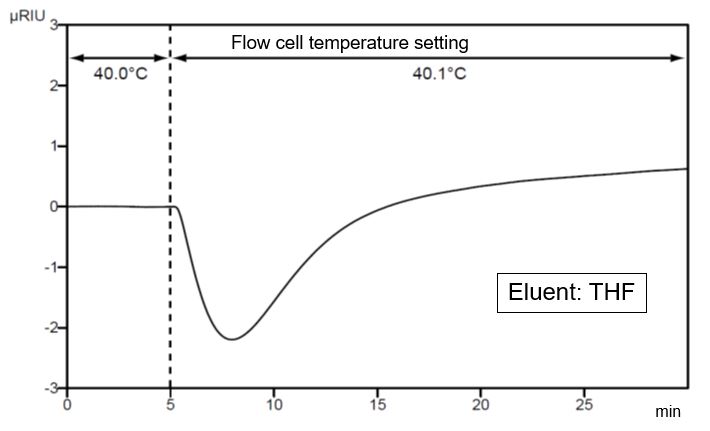
To minimise drift, the temperature control system, included as standard equipment, should be adjusted according to room temperature, eluent flow rate, and other conditions. It is generally recommended to set it above room temperature for optimal stability.
Negative Peaks
Negative peaks can appear in a chromatogram due to differences in detection principles. In a refractive index (RI) detector, a negative peak indicates that the sample’s refractive index is lower than that of the eluent. To obtain positive peaks, the detector polarity can be reversed.
In a UV detector, negative peaks occur when the sample absorbs less UV light than the eluent. This issue can often be resolved by using a different mobile phase with lower UV absorbance. If eluent recycling is in use, replacing the recycled eluent with fresh solvent can help prevent interference.
Concentration Outside the Linear Range of the Detector
Sensitivity issues in chromatography can arise from various factors, such as sample losses during preparation or incorrect injection volumes. Another critical factor is sample concentration, which can significantly impact detector performance. If the concentration is too high or too low, it may fall outside the detector’s linear range, leading to inaccurate results.

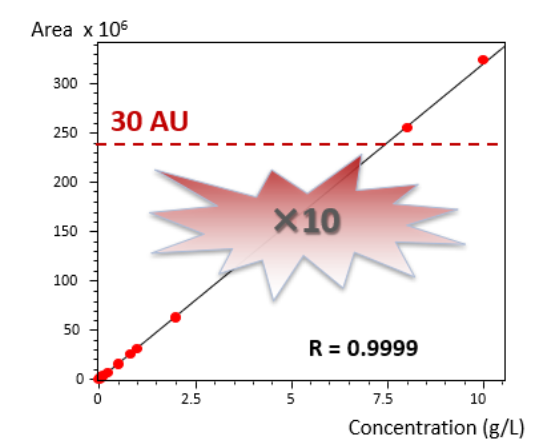
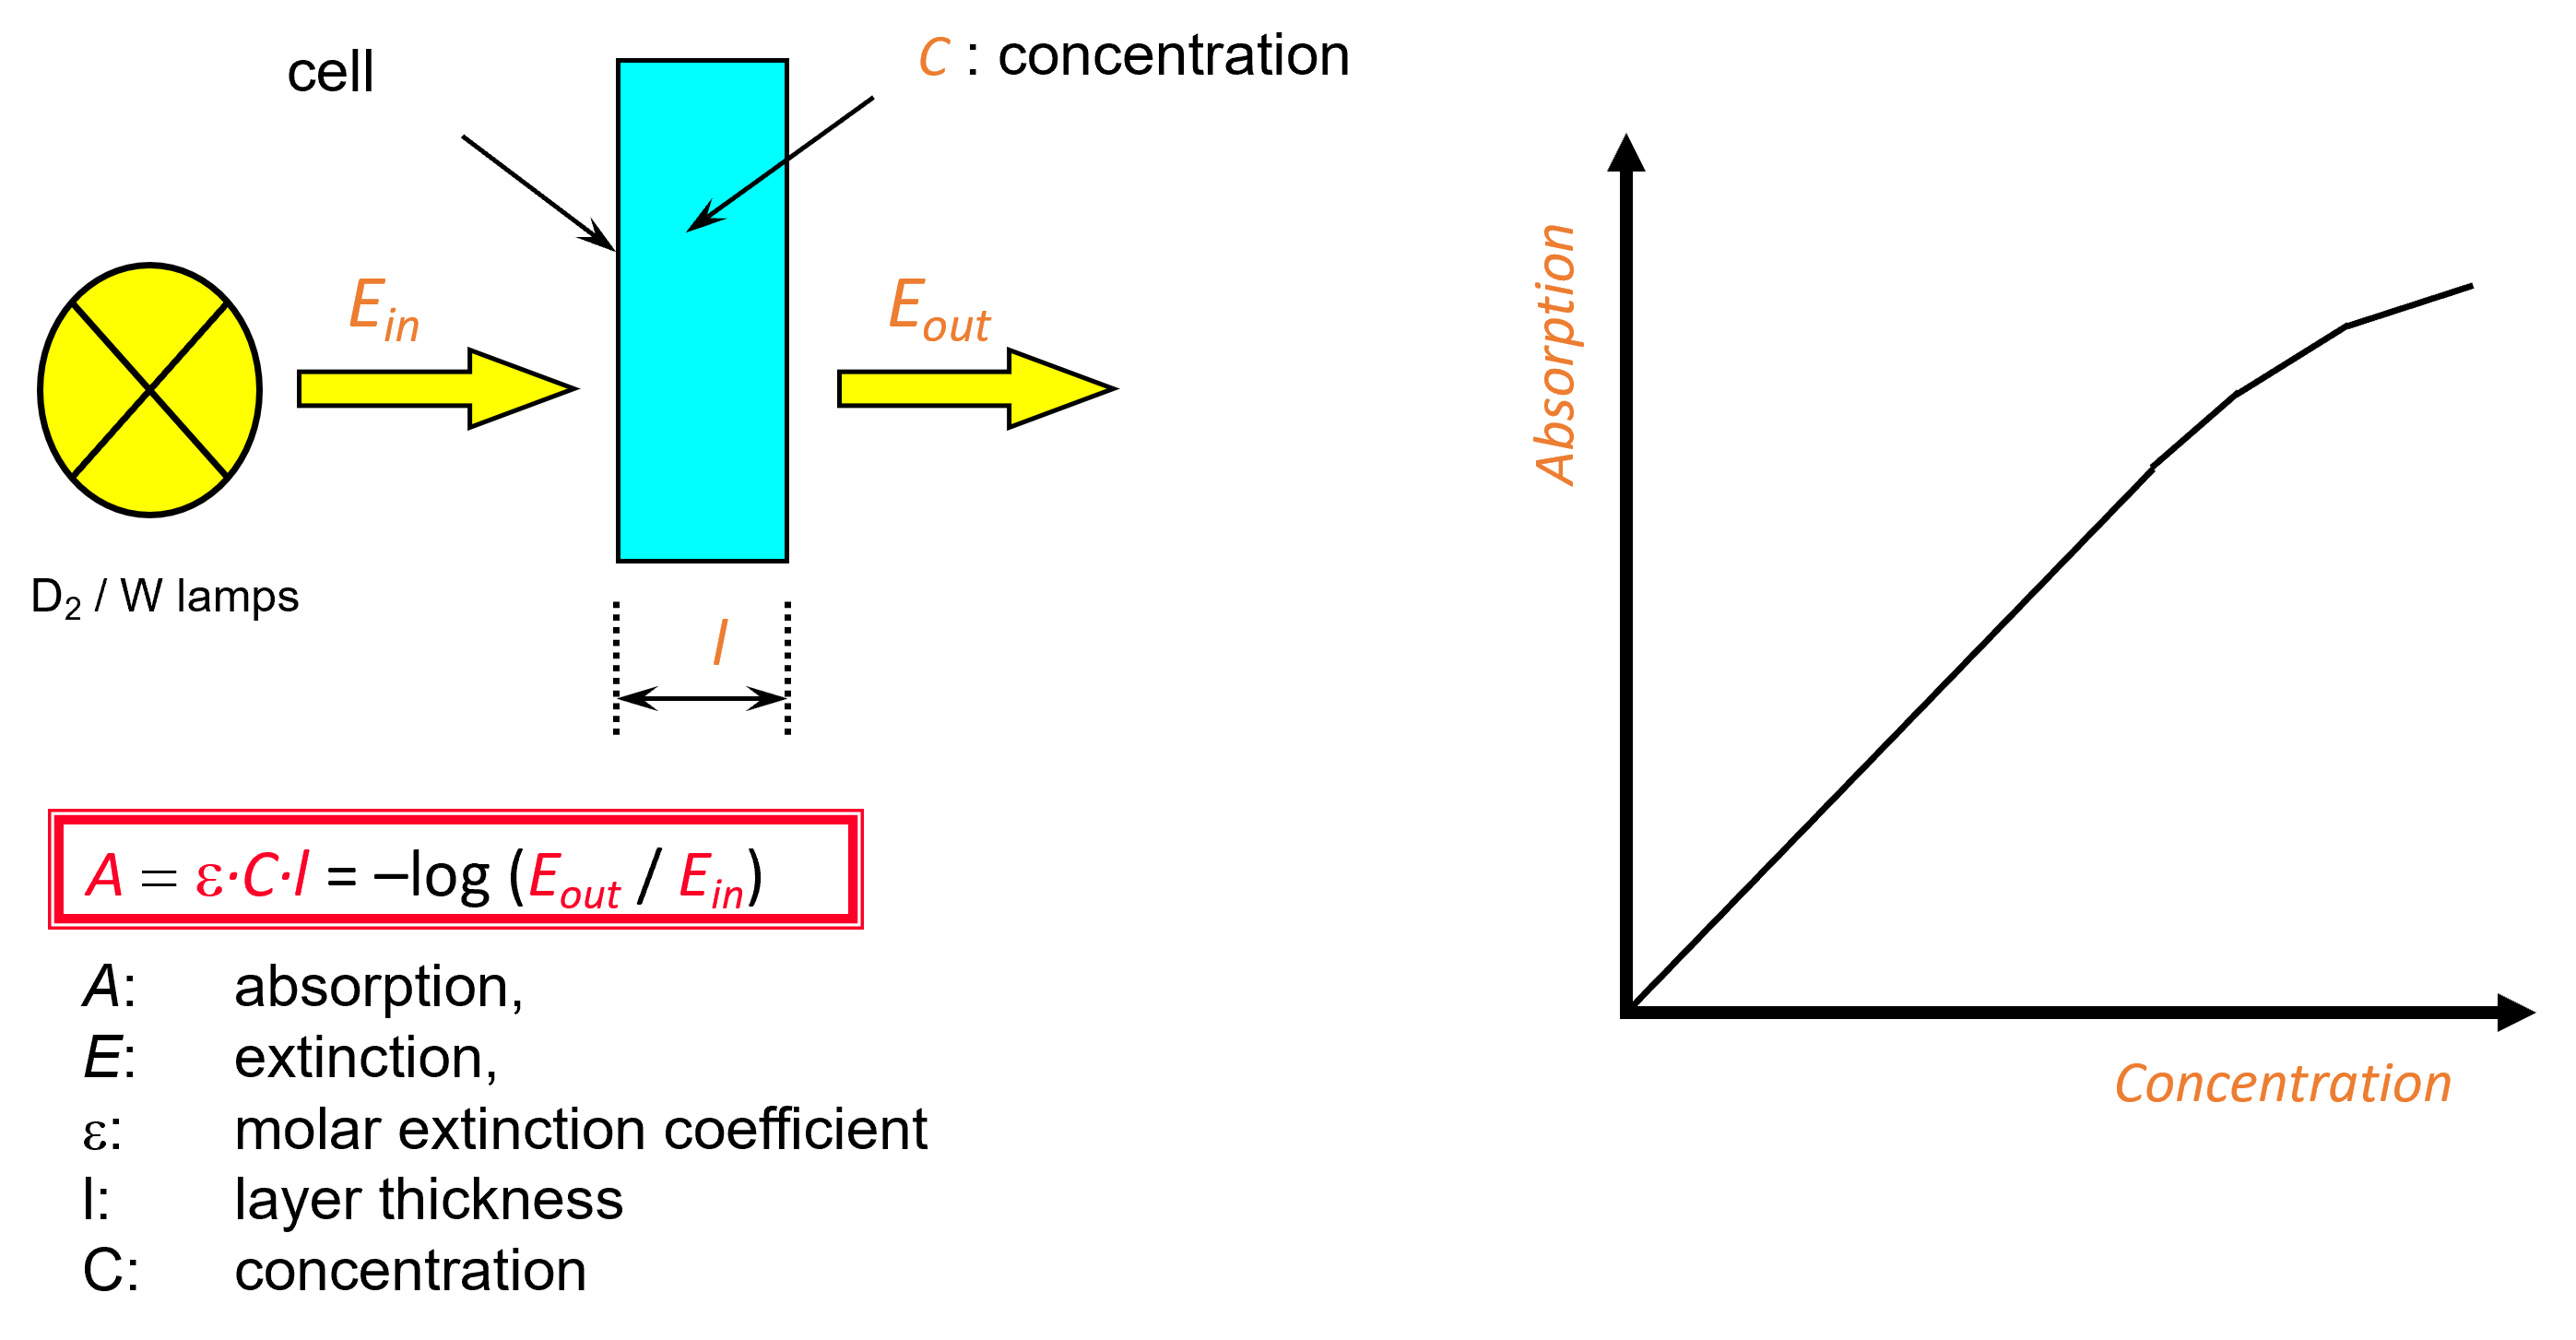
In UV absorption detection, the Beer-Lambert law defines the relationship between absorption, extinction coefficient, concentration, and path length (see left figure). This principle allows for concentration calculations based on absorption. However, the linear relationship between concentration and absorption holds only within a specific range, defined by the limit of detection (LOD) and the concentration maximum (see right figure). Outside this range, concentration measurements become unreliable.
To address this issue, diluting or concentrating the sample is a straightforward solution.
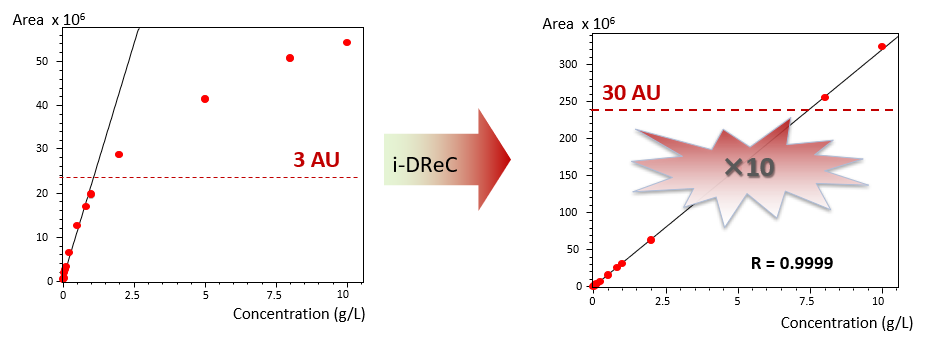
Another option is the i-DReC (Intelligent Dynamic Range Extension Calculator) function, a feature of LabSolutions software when used with a photodiode array detector. This function enables accurate quantification of highly concentrated samples and allows simultaneous analysis of both high- and low-concentration samples (see figure below).
In the next troubleshooting section, we will explore flow line leakage and its impact on system performance.
Your Shimadzu LC Team
Related Resources
-
-
i-DReC Application in Impurity Analysis
-